PURPOSE:
Equipment: Cart, Ramp, Blocker, Labquest, Stilts for Ramp, Motion Detector.
Procedure:
1. Prepare the track and Motion Detector for data collection.
3. Place the cart on the track near the bottom end stop. If your cart has a plunger, face the plunger away from the Motion Detector. Start data collection. You will notice a clicking sound from the Motion Detector. Wait about a second, then briefly push the cart up the ramp, letting it roll freely up nearly to the top, and then back down. Catch the cart as it nears the end stop.
4. Examine the position vs. time graph. Repeat Step 3 if your position vs. time graph does not show an area of smoothly changing distance. Check with your instructor if you are not sure whether you need to repeat data collection.
Data/Analysis:
- Collect distance, velocity, and acceleration
data as a cart rolls up and down a ramp.
- Analyze the position vs. time, velocity vs.
time, and acceleration vs. time
graphs.
- Determine the best fit equations for the
distance vs. time and velocity vs. time graphs.
- Determine
the mean acceleration from the acceleration
vs. time graph.
Equipment: Cart, Ramp, Blocker, Labquest, Stilts for Ramp, Motion Detector.
Procedure:
1. Prepare the track and Motion Detector for data collection.
- Attach the Motion Detector Bracket to the track (see
Figure 1).
- Attach the Motion Detector to the Motion Detector
Bracket.
- Adjust the position of the Motion Detector Bracket so
the Motion Detector is 0.15 m from the end of the track.
- Set the switch on the Motion Detector to the Track
position.
3. Place the cart on the track near the bottom end stop. If your cart has a plunger, face the plunger away from the Motion Detector. Start data collection. You will notice a clicking sound from the Motion Detector. Wait about a second, then briefly push the cart up the ramp, letting it roll freely up nearly to the top, and then back down. Catch the cart as it nears the end stop.
4. Examine the position vs. time graph. Repeat Step 3 if your position vs. time graph does not show an area of smoothly changing distance. Check with your instructor if you are not sure whether you need to repeat data collection.
Data/Analysis:
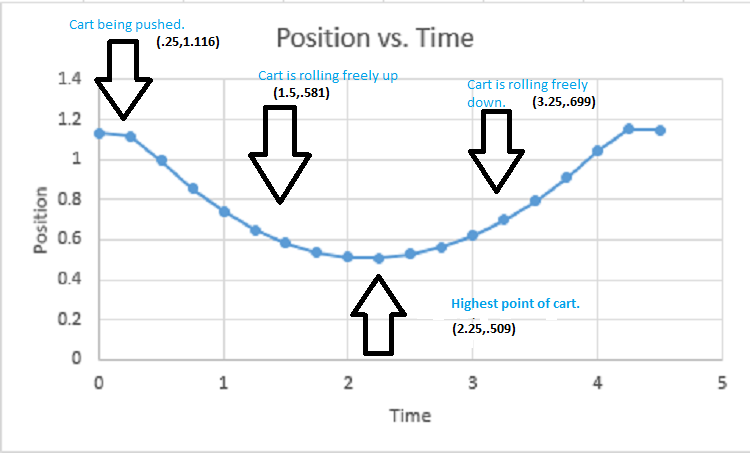
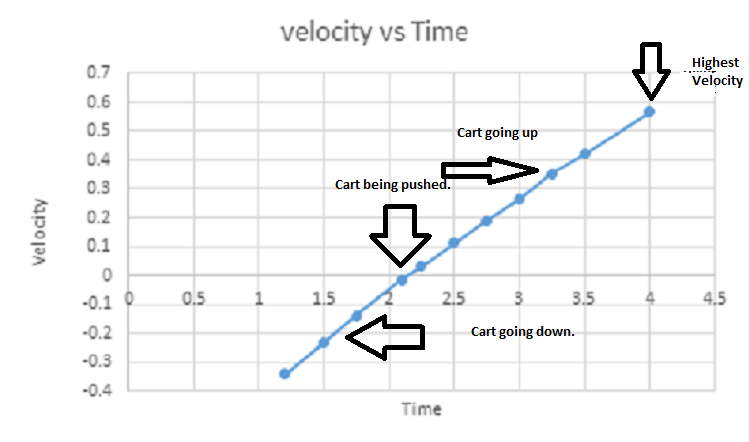
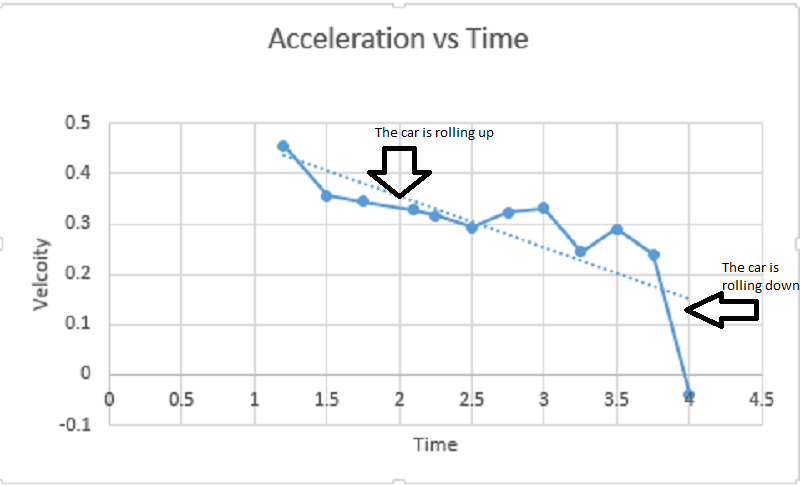
Conclusion: In this lab we learned how the graphs for position, velocity, and acceleration looked when we rolled a car up and down a ramp.
1. The slope and acceleration was between .03 points away from each other each time.
2. (4,.566)
3. (1.45, .46)
4. Yes
5. N. The graphs do not look anything alike.
6. The slope stands for the acceleration. Y stands for Velocity. .50 is the position.
7. Position: The graph would be a straight, diagonal line.
Velocity: The graph would be a straight, diagonal line.
Acceleration: The graph would be a straight, horizontal line.
